> ## Documentation Index
> Fetch the complete documentation index at: https://help.berocker.com/llms.txt
> Use this file to discover all available pages before exploring further.
# Dashboard
> Your numbers — leads, revenue, margin, conversion, response times — with every tile telling you what it actually measures.
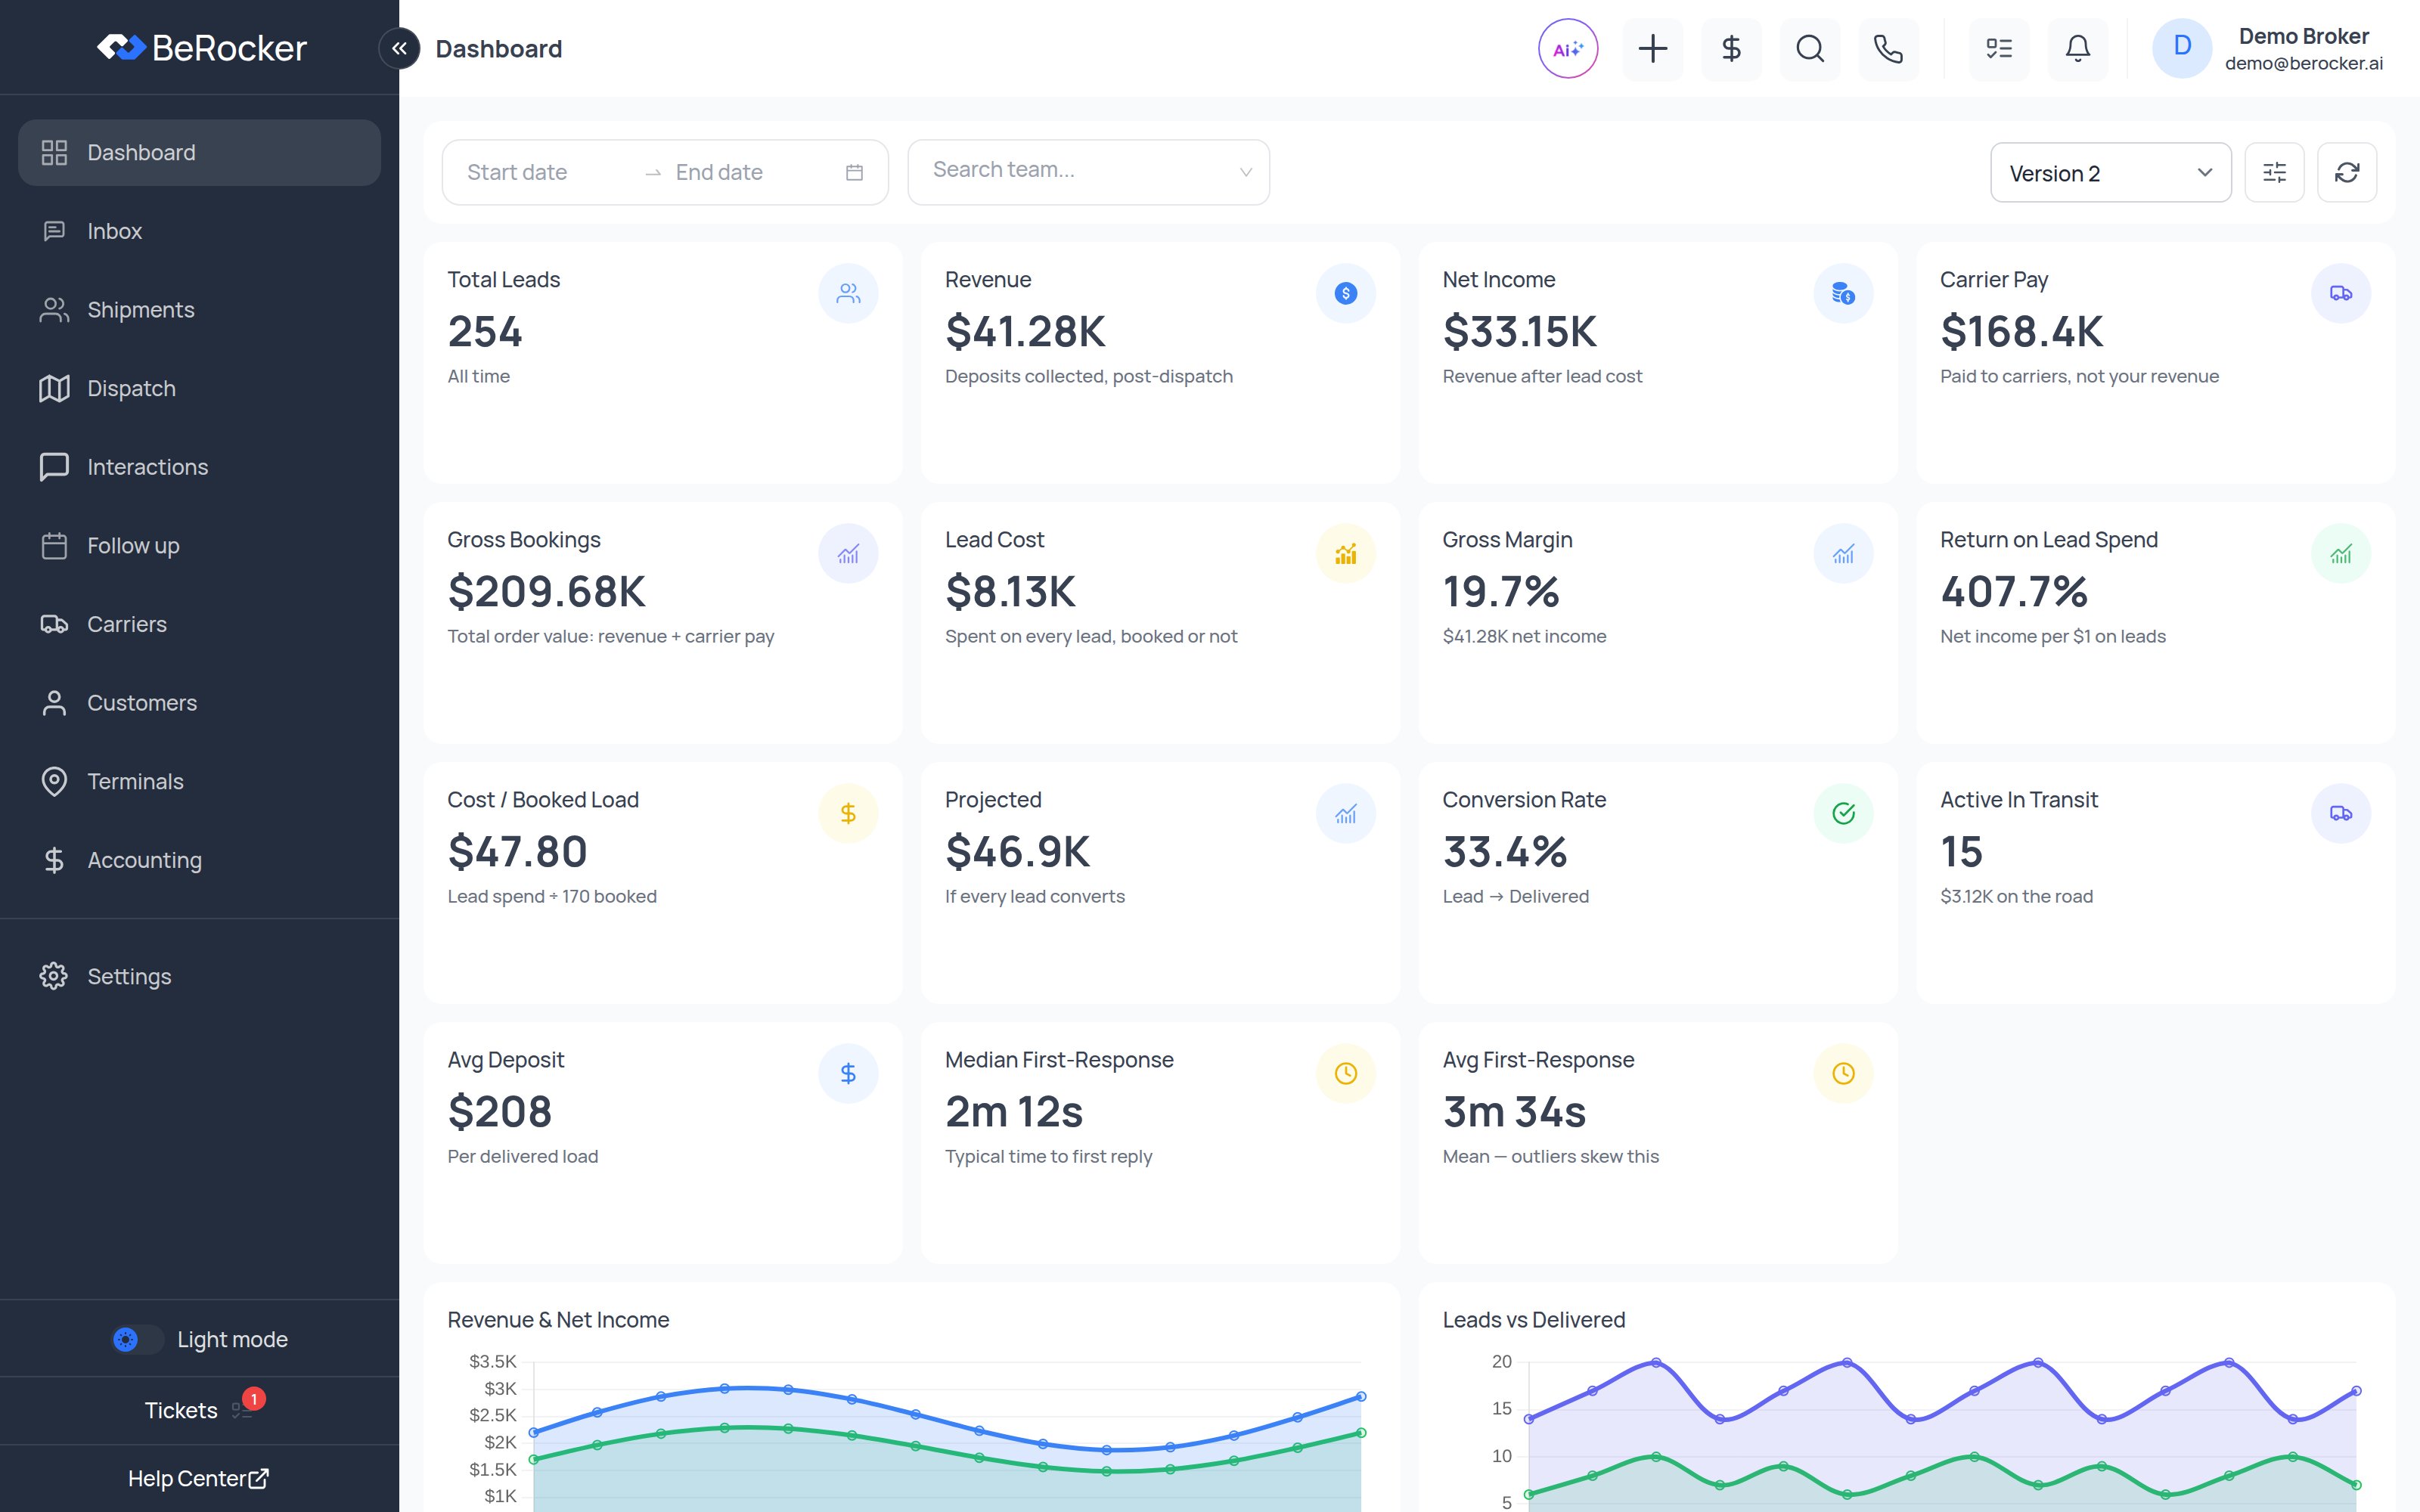
The **Dashboard** answers "how are we doing" without anybody exporting a spreadsheet. Every tile
says underneath the number exactly what it counts, so nobody has to guess whether "Revenue" means
deposits or gross bookings.
 ***
## Filters
Across the top: a **date range**, a **team / agent** picker, and a **refresh** button. Leave the
date range empty for all-time.
Period-over-period comparison arrows only appear when you filter to a date range. An unfiltered
dashboard is all-time and has nothing to compare against.
***
## The tiles
| Tile | What it is |
| ------------------------- | -------------------------------------------------------------------------------- |
| **Total Leads** | Every lead in the period. |
| **Revenue** | Deposits collected, post-dispatch. This is your money, not the customer's total. |
| **Net Income** | Revenue after lead cost. |
| **Carrier Pay** | Paid to carriers — *not* your revenue. |
| **Gross Bookings** | Total order value: revenue + carrier pay. |
| **Lead Cost** | Spent on every lead, booked or not. |
| **Gross Margin** | Net income as a share of gross bookings. |
| **Return on Lead Spend** | Net income per \$1 spent on leads. |
| **Cost / Booked Load** | Lead spend ÷ booked loads. |
| **Projected** | What you would make if every lead in the period converted. |
| **Conversion Rate** | Lead → Delivered. |
| **Active In Transit** | Loads on the road right now, and the deposit value riding on them. |
| **Avg Deposit** | Per delivered load. |
| **Median First-Response** | Typical time to your first reply. |
| **Avg First-Response** | The mean — outliers skew this, which is why the median is next to it. |
Watch the **median** first-response, not the average. One agent who left for lunch mid-thread can
drag the mean into fiction; the median tells you what a normal customer experiences.
***
## The charts
* **Revenue & Net Income** over time.
* **Leads vs Delivered** over time — volume in against loads out.
* **Margin trend** — your gross margin percentage day by day.
* **Pipeline funnel** — how many leads reached New, Order, Signed, Paid, Posted, Dispatched and
Delivered. Where the funnel narrows is where your process leaks.
* **Top agents** — deposit total on booked loads and delivered count per agent.
* **Top lanes** — ranked by gross bookings, with revenue and lead count.
* **Lead sources** — per source: leads, booked, revenue, lead cost, net income, cost per booked
load, and booking rate.
The lead-sources table is the one to check before renewing a provider contract. A source with lots
of leads and a poor booking rate can cost more than it brings in.
***
## Dashboard versions
The version picker in the top right switches between dashboard layouts (Version 1, 2, 3). They show
the same underlying data in different arrangements — pick whichever your team reads fastest.
***
## Related
Leads status, user charges and lead sources, exportable.
The transactions behind the revenue number.
The loads behind "Active In Transit".
Where the lead cost figures come from.
***
## Filters
Across the top: a **date range**, a **team / agent** picker, and a **refresh** button. Leave the
date range empty for all-time.
Period-over-period comparison arrows only appear when you filter to a date range. An unfiltered
dashboard is all-time and has nothing to compare against.
***
## The tiles
| Tile | What it is |
| ------------------------- | -------------------------------------------------------------------------------- |
| **Total Leads** | Every lead in the period. |
| **Revenue** | Deposits collected, post-dispatch. This is your money, not the customer's total. |
| **Net Income** | Revenue after lead cost. |
| **Carrier Pay** | Paid to carriers — *not* your revenue. |
| **Gross Bookings** | Total order value: revenue + carrier pay. |
| **Lead Cost** | Spent on every lead, booked or not. |
| **Gross Margin** | Net income as a share of gross bookings. |
| **Return on Lead Spend** | Net income per \$1 spent on leads. |
| **Cost / Booked Load** | Lead spend ÷ booked loads. |
| **Projected** | What you would make if every lead in the period converted. |
| **Conversion Rate** | Lead → Delivered. |
| **Active In Transit** | Loads on the road right now, and the deposit value riding on them. |
| **Avg Deposit** | Per delivered load. |
| **Median First-Response** | Typical time to your first reply. |
| **Avg First-Response** | The mean — outliers skew this, which is why the median is next to it. |
Watch the **median** first-response, not the average. One agent who left for lunch mid-thread can
drag the mean into fiction; the median tells you what a normal customer experiences.
***
## The charts
* **Revenue & Net Income** over time.
* **Leads vs Delivered** over time — volume in against loads out.
* **Margin trend** — your gross margin percentage day by day.
* **Pipeline funnel** — how many leads reached New, Order, Signed, Paid, Posted, Dispatched and
Delivered. Where the funnel narrows is where your process leaks.
* **Top agents** — deposit total on booked loads and delivered count per agent.
* **Top lanes** — ranked by gross bookings, with revenue and lead count.
* **Lead sources** — per source: leads, booked, revenue, lead cost, net income, cost per booked
load, and booking rate.
The lead-sources table is the one to check before renewing a provider contract. A source with lots
of leads and a poor booking rate can cost more than it brings in.
***
## Dashboard versions
The version picker in the top right switches between dashboard layouts (Version 1, 2, 3). They show
the same underlying data in different arrangements — pick whichever your team reads fastest.
***
## Related
Leads status, user charges and lead sources, exportable.
The transactions behind the revenue number.
The loads behind "Active In Transit".
Where the lead cost figures come from.